Running Analytical Queries on Your SaaS Data at a Single Place

Most modern businesses use a variety of SaaS platforms to track and measure performance. Some rely on Google Ads analytics or Facebook ads analytics to monitor paid campaigns, others do PostHog analytics for in-app behavior tracking, and many look to do HubSpot analytics or Zoho analytics for CRM and finance data.
Often, there is also a need for straightforward Google sheet analytics (if you have a lot of data there and a lot of sub-sheets as well) to manage custom KPIs.
All of this often requires you to join data from multiple SaaS sources to each other or sometimes to database data as well.
Combining all this information to see overall monthly traffic, pipeline health, or revenue impact can become overwhelming. Manually exporting data from each platform—such as a PostHog export or a Facebook data export—and merging it is time-consuming and error-prone.
Most teams discover that building a robust data pipeline on their own is neither simple nor scalable.
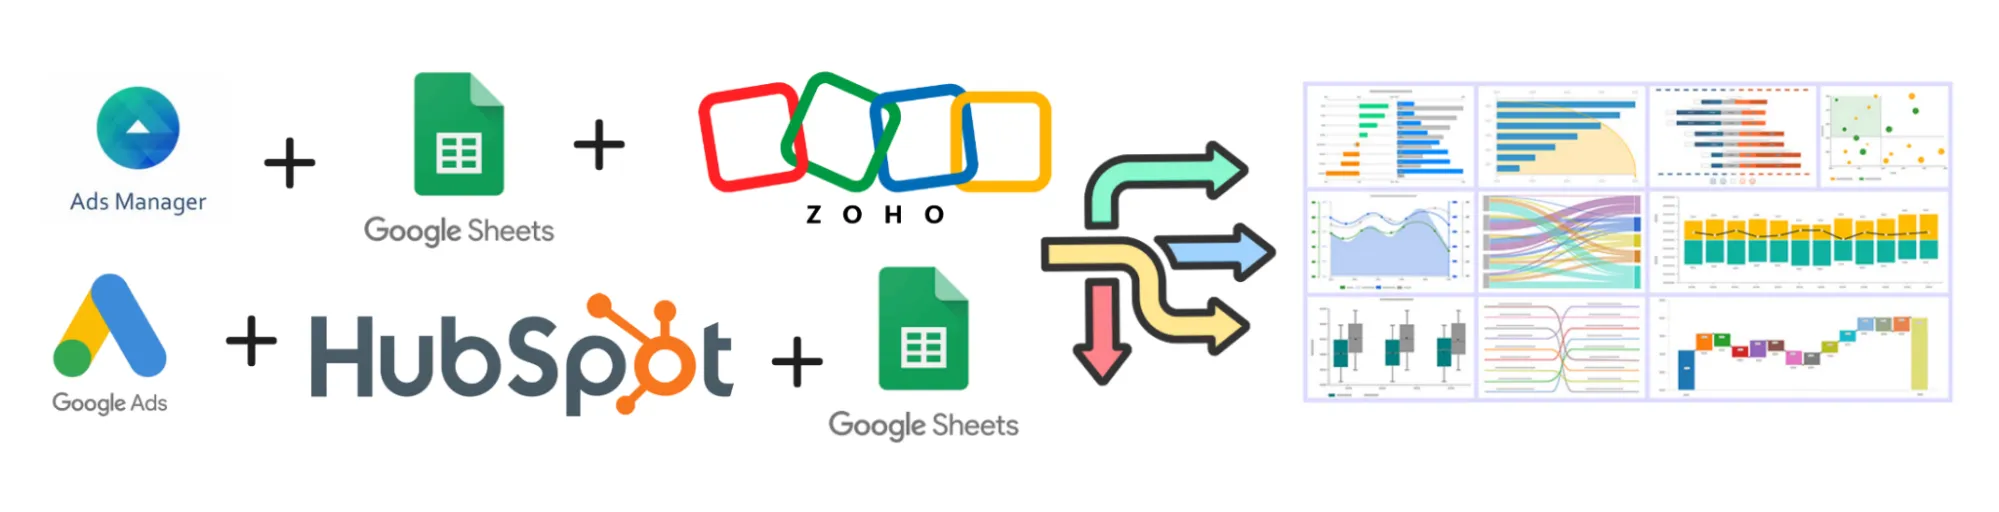
That’s where Datazip’s OneStack comes in. It automatically, once configured, gathers or pulls data from multiple sources—like Facebook analytics, Zoho CRM, HubSpot, and more—pulling them into a single data warehouse (e.g., a ClickHouse) for easier aggregation, reporting and analysis.
We’ll look at some of the most commonly used SaaS data sources, talk about how to unify them, and finally discuss queries that help you build a robust medallion architecture.
Also read: OpenEngine - Storage and Compute Isolation technology by OneStack
Rest assured, there’s no fluff here—just straight, factually correct insights.
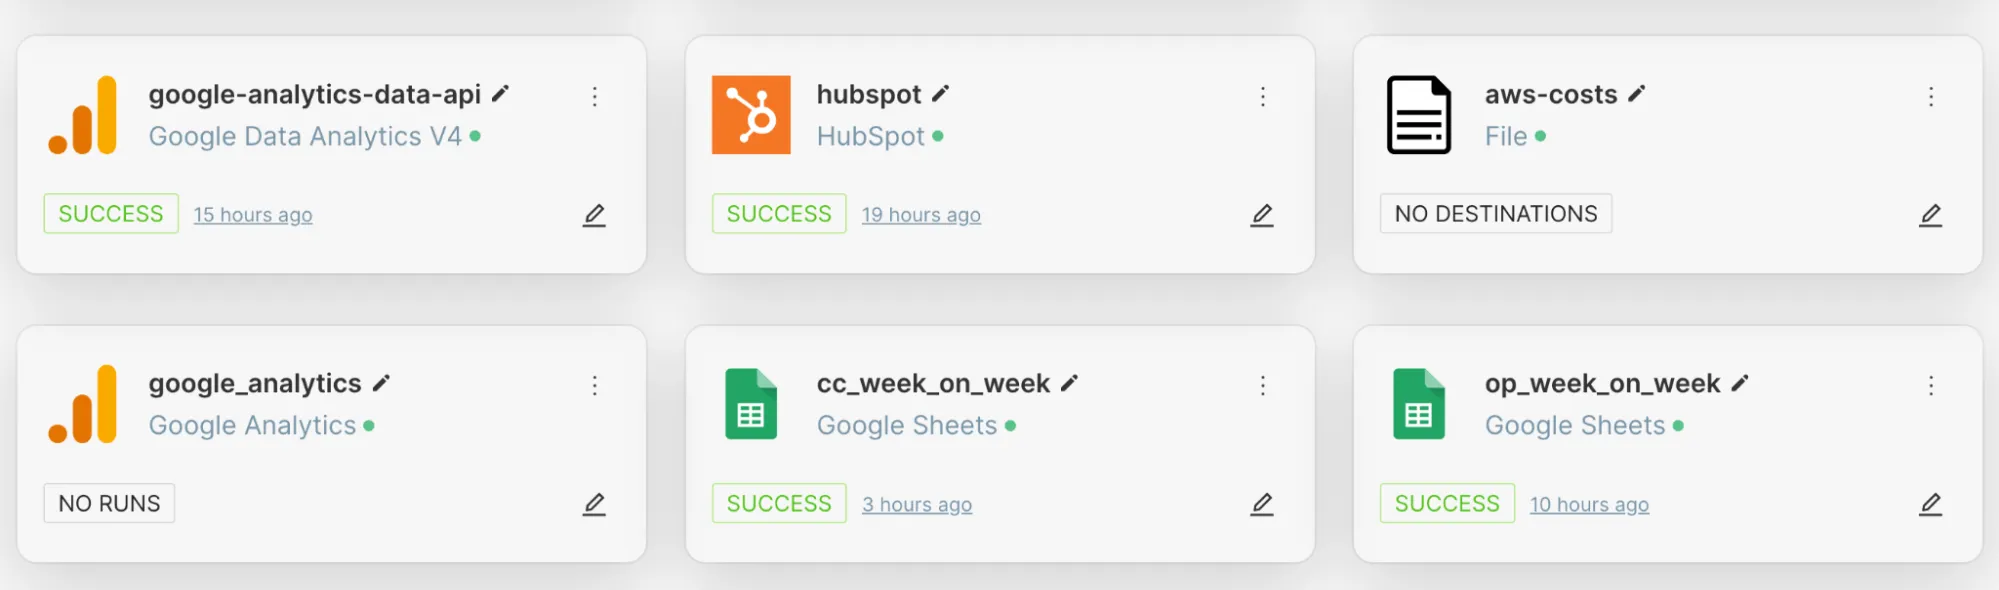
Our clients have successfully connected Google Analytics, HubSpot, File based syncs, Google Sheets and do analytics 10x faster now.
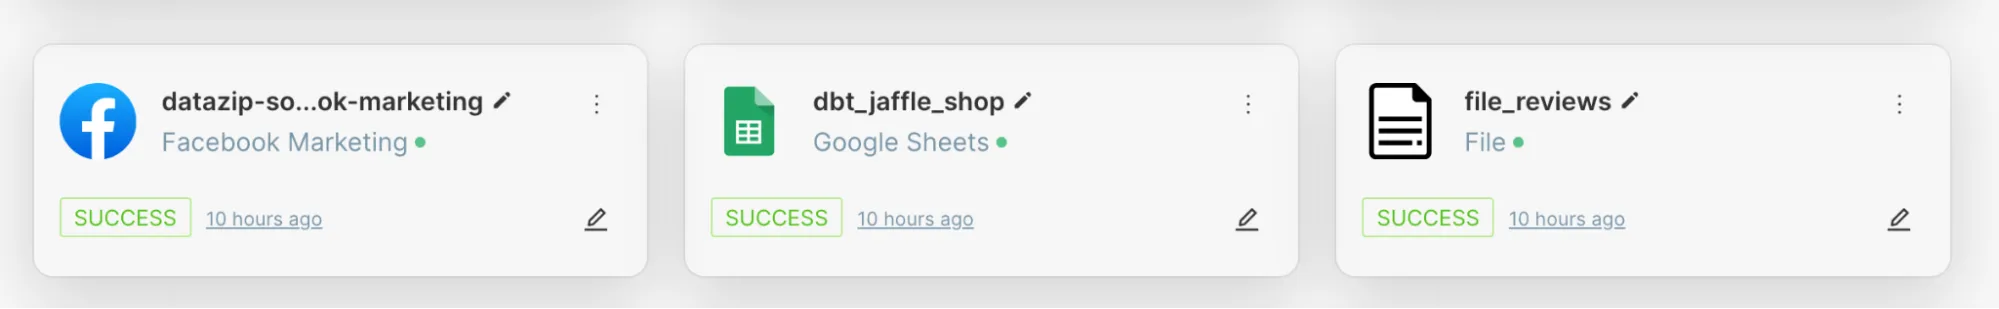
Here’s an image of Facebook Marketing Data [more on that later] sync successful connection.
Find all 150+ connectors here.
Why Aggregate Data in the First Place?
-
Bird’s-Eye View: When your data is unified, you get a complete 360-degree overview of your business. This could mean analyzing ad spend from Google Ads alongside user engagement from Firebase, connecting CRM metrics to it and on top of that, having Google Analytics Data all in one dashboard.
-
Faster Decision Making: By centralizing data into a single warehouse (like ClickHouse, which Datazip’s OneStack Data uses), you reduce time wasted switching between platforms or exporting CSVs from multiple systems (we do support file based uploads as well,
csv,xlsx, etc). -
Consistent Metrics: When data lives in multiple platforms, definitions of metrics can differ. A single source of truth ensures consistency in how metrics (such as “Active Users” or “MQL(Marketing Qualified Leads) to SQL (Sales Qualified Leads) conversion rates”) are calculated.
-
Better Collaboration: With all your data in one place, multiple teams—marketing, sales, finance—speak the same language when looking at performance figures using our fine Role based access based RBAC to carefully assign roles to your team.
-
Data you can trust: With a single source of data (data models generated after syncing from various sources), you have a single store of trustable data and now you are better equipped to make business decisions driven by business logic– all at a single place.
Who Benefits from an Aggregate View of Data?
-
CEOs: Gain a 360-degree view of the entire business—from marketing and sales to finance and operations—making it easier to spot strategic opportunities or potential risks.
-
CMOs: Quickly see which campaigns (across Google Ads, Facebook, HubSpot, etc.) drive the most revenue or highest-quality leads, and optimize marketing spend accordingly.
-
CFOs: Get real-time insight into cash flow and expenses—by merging finance data (e.g., Zoho Books) with sales or ad spend data, they can better forecast and control costs.
-
COOs: Spot operational bottlenecks or inefficiencies faster by bringing data from multiple SaaS tools (e.g., CRM, ticketing systems, etc.) into one place.
-
Other Leadership Roles (CTOs, CIOs, VP of Analytics, etc.): Benefit from a unified, secure data infrastructure that makes analytics more efficient—no more siloed or duplicated efforts across departments.
Manual Merging is Painful, here’s why!
-
Multiple Formats, One Chaos
Each SaaS tool exports data in different formats. A Facebook export might label a column “CTR,” while Google analytics export uses “Click Through Rate.” Manual mapping becomes a constant headache. -
Time Zone and Currency Confusion
Marketing platforms often use different time zones or currencies, making it difficult to align your Facebook marketplace analytics with data from other sources, like Zoho Books for invoice details.To solve this, you can write DBT transformations jobs / SQL queries (one time) that makes your final model (to be used for analytics ) ready with consistent Time Zone formats and currency conversion.
-
Versioning & Data Quality
Frequent updates can change fields or add new parameters. Without a unified pipeline, changes in Facebook ad analytics or Hubsport fields can lead to broken spreadsheets and inconsistent reporting. Missing values is another key issue when you merge data manually. -
Wasted Resources
Creating queries, macros, and scripts to unify google sheet analytics with posthog data export might work in the short term, but it seldom scales. Teams end up spending more time cleaning data than actually analyzing it.
Popular SaaS Sources
While OneStack integrates with a wide range of tools, let’s focus on some of the most common SaaS data sources our customers connect:
Also read - All about Datazip’s OneStack value proposition and what we provide to make your analytics 10x faster.
1. Google Analytics & Google Analytics 4 (GA4)
Google analytics export alone might capture website-based metrics but lacks visibility into deeper user actions (e.g., in-app events or offline conversions). Hence, with onestack data:
What You Get: Traffic metrics, user behavior, goal conversion data, session-level statistics, and more.
Use Case: Combine GA4 web analytics with data from your CRM to see how marketing campaigns are influencing lead conversions.
Example: If you notice a spike in “Sessions from Organic Search” but a dip in conversions for a specific geography, you can cross-check with other data sources (e.g., local campaign data in Google Ads) to pinpoint what’s causing the discrepancy.
2. Google Ads
Google shopping ads analytics and search ads run across different networks, making it tricky to combine with direct web analytics or social campaigns.
What You Get with us: Ad spend, impressions, clicks, cost-per-click, conversions, and campaign-level metrics.
Use Case: Merge your Google Ads spend data with revenue data from Zoho Books to calculate a more accurate Return on Ad Spend (ROAS).
Example: You can easily tie in how much you’re spending on a specific keyword versus the revenue generated from leads who clicked on that keyword.
3. Google Sheets
Connect your Google sheet analytics data with our connector.
What You can export to us: Analytics for your Custom data, manually updated KPIs (with incremental syncs for updated data), product roadmaps, or campaign trackers that don’t fit in conventional SaaS platforms.
Use Case: Imagine your marketing team keeps monthly budgets in Google Sheets. Pull this data into your central warehouse to compare planned vs. actual spending.
Example: Combine your curated offline data in Google Sheets (like field research or trade show leads) with online leads from HubSpot to get a full prospect pipeline.
4. HubSpot
Connect HubSpot to us and:
What You Get: CRM data like leads, deals, lifecycle stages, email engagement synced a single source.
Use Case: By blending HubSpot deal pipelines with usage data from Firebase, you can understand not just who is buying but also how they’re using the product.
Example: If a lead has engaged with your website blog (tracked in HubSpot) and also actively uses your app (tracked in Firebase), you can build a segmented campaign to upsell advanced features.
5. Firebase
What You Get: Mobile analytics, in-app events, crash reports, user engagement metrics after you sync the data and connect a BI tool (p.s - you can connect to our warehouse via APIs too).
Use Case: Combine Firebase engagement metrics with, say, Facebook Marketing campaigns, to see which campaigns drive the most loyal app users.
Example: If your Facebook ad campaign leads to new users who have an unusually high “time spent in app,” you might double down on that targeting.
6. Facebook Marketing
Many teams rely on Facebook ad analytics or Facebook advanced analytics but store lead or revenue data elsewhere, such as HubSpot or Zoho data analytics.
What You Get: Campaign performance data, CTR, CPC, audience insights, and ad creative performance.
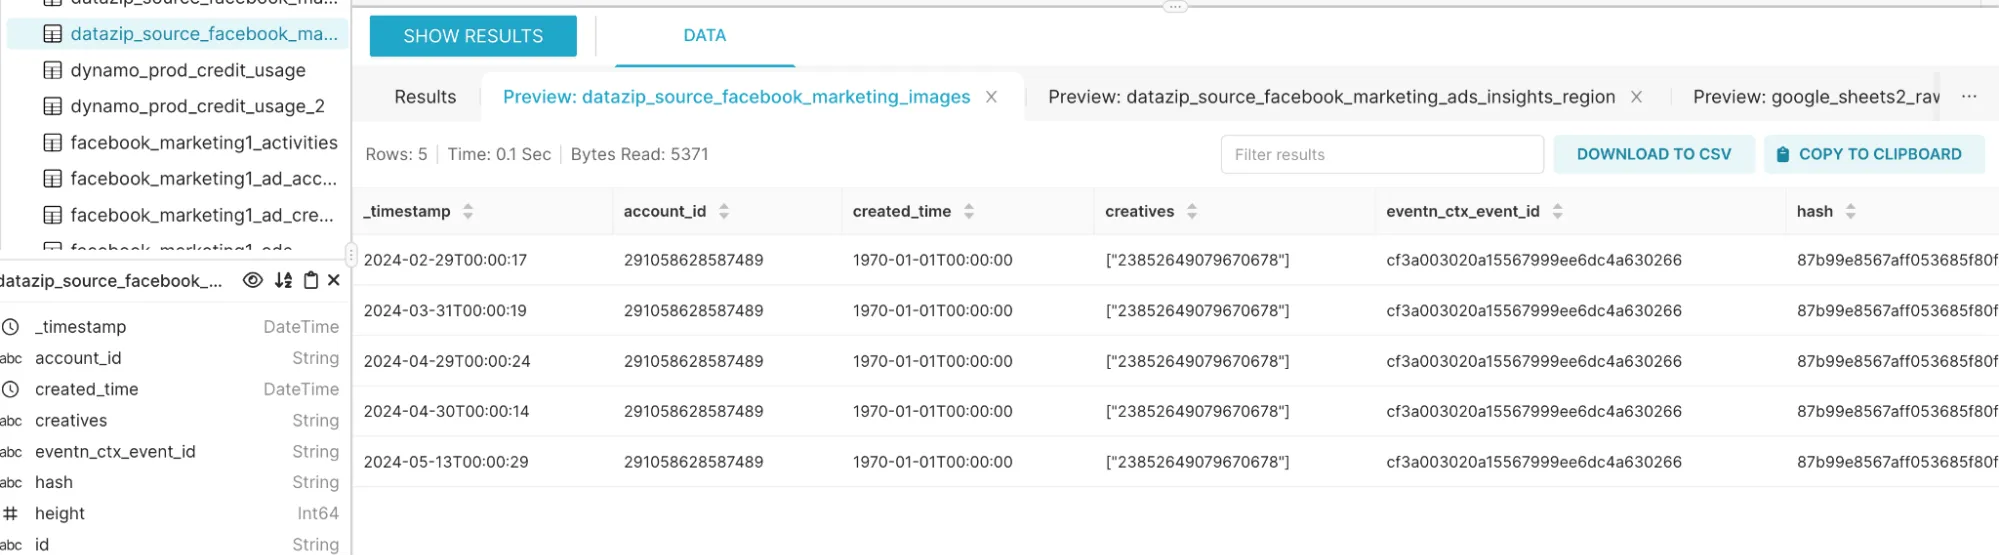
Here’s a sample preview of Facebook Marketing data synced to our platform for you to write queries and sanitise the data points you need.
Use Case: Compare your Facebook ads’ performance with Google Ads data to reallocate budgets based on the best-performing platform.
Example: In OneStack, you can run queries that cross-reference campaign IDs from Facebook with leads in HubSpot to see if the conversions match the reported metrics.
7. Zoho Books
Zoho data analytics can help track invoices, expenses, and subscription details, but linking this information to marketing or app usage platforms is often manual. That’s why we created OneStack so you can:
What You Get: Invoices, expenses, subscription details, receivables, and payables.
Use Case: Real-time analysis of cash flow against your ad spend in Google Ads. This helps you measure profitability and detect potential overspending or under-allocation of funds.
Example: Linking Zoho Books with sales data from HubSpot can give you a precise margin analysis. You can isolate campaigns bringing high revenue but also factor in cost and overhead from Zoho Books.
8. PostHog Analytics
Large websites or apps generate millions of events, making manual data handling in a PostHog data warehouse challenging (not to mention the UI gets clunky or does not respond sometimes when querying data or loading charts).
A PostHog export might not easily integrate with spreadsheet-based tracking or other event data sources. Native Posthog will let you write SQL queries for the data that they capture, but if you need various other sources (Google Analytics or Facebook Ad spend metrics after someone lands of a page), sync data to our central warehouse.
9. Find more SaaS connectors here
Meet Datazip’s OneStack
OneStack is Datazip’s approach to bringing all your data pipelines under one umbrella. It supports 150+ data connectors, meaning it can practically connect to any service you currently use (and likely the ones you plan to use in the future!).
Key Highlights:
-
Easy Onboarding: You don’t need a huge tech team or a big operational budget to get started. The platform is built to be user-friendly, letting you simply log in (
OAuthauthentication), select sources, and authenticate. -
Scalability: Whether you have 1,000 rows a month or 10 billion, OneStack can handle the load. It runs on robust cloud-based infrastructure, pulling and loading data seamlessly into ClickHouse.
-
Automated Data Flows: Set your own refresh schedules—Minutes, hourly, daily, or weekly. OneStack automates the process, ensuring your analytics are always up-to-date.
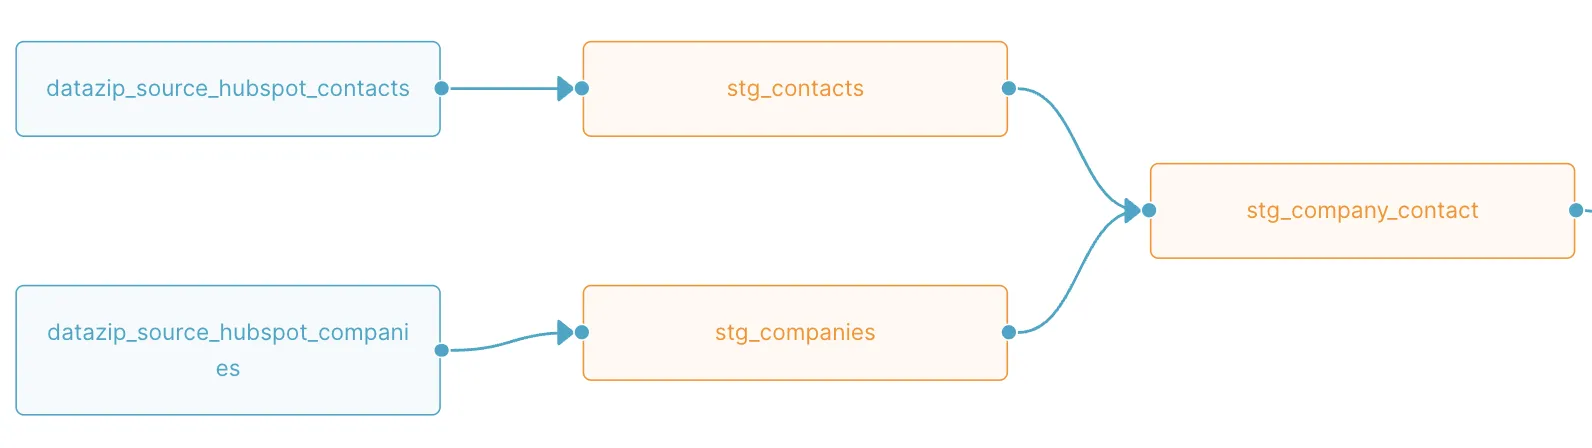
How It All Comes Together: The Medallion Architecture
SaaS connectors flatten the data received from multiple SaaS sources into relational tables (with columns and rows).
A simple SQL based transformation framework makes it easy for you to query, clean, transform, aggregate and join data from multiple SaaS sources.
Below is a simple example of transformation you can write to combine data from SaaS source and one database where you can just write a SQL and lineage is automatically generated. Also it gives you the ability to run tests on your SaaS data around freshness and correctness.
Bronze Layer (Raw Data)
-
This is the initial stage where you pull raw data from each source—Google Analytics, HubSpot, Zoho Books, etc.
-
Data arrives in its original form in ClickHouse without any transformations.
Silver Layer (Cleaned & Enriched)
-
In this layer, you clean and standardize the data. For instance, you might convert time zones for consistent reporting or rename columns (e.g., “CPC” in Google Ads to “
cost_per_click”) to maintain uniformity. You can do all this using our DBT based transformation layer. -
You might also enrich the data by adding external lookups—like matching country codes to region names or mapping lead status from numeric to more descriptive values.
Gold Layer (Aggregated & Modeled)
-
Here, you aggregate the data into business-specific tables or views—such as “
marketing_campaigns_performance” or “customer_lifetime_value_by_channel.” -
You then use these aggregated tables for dashboards, machine learning models, or advanced analytics. This is the layer that most end-users or business stakeholders directly interact with.
Bronze -> Silver -> Gold layer data [Medallion Architecture]
Setting up OneStack: A Sneak Peek
(In the actual blog, we’ll include screenshots showing each step—connecting sources, running transformations, and building dashboards.)
-
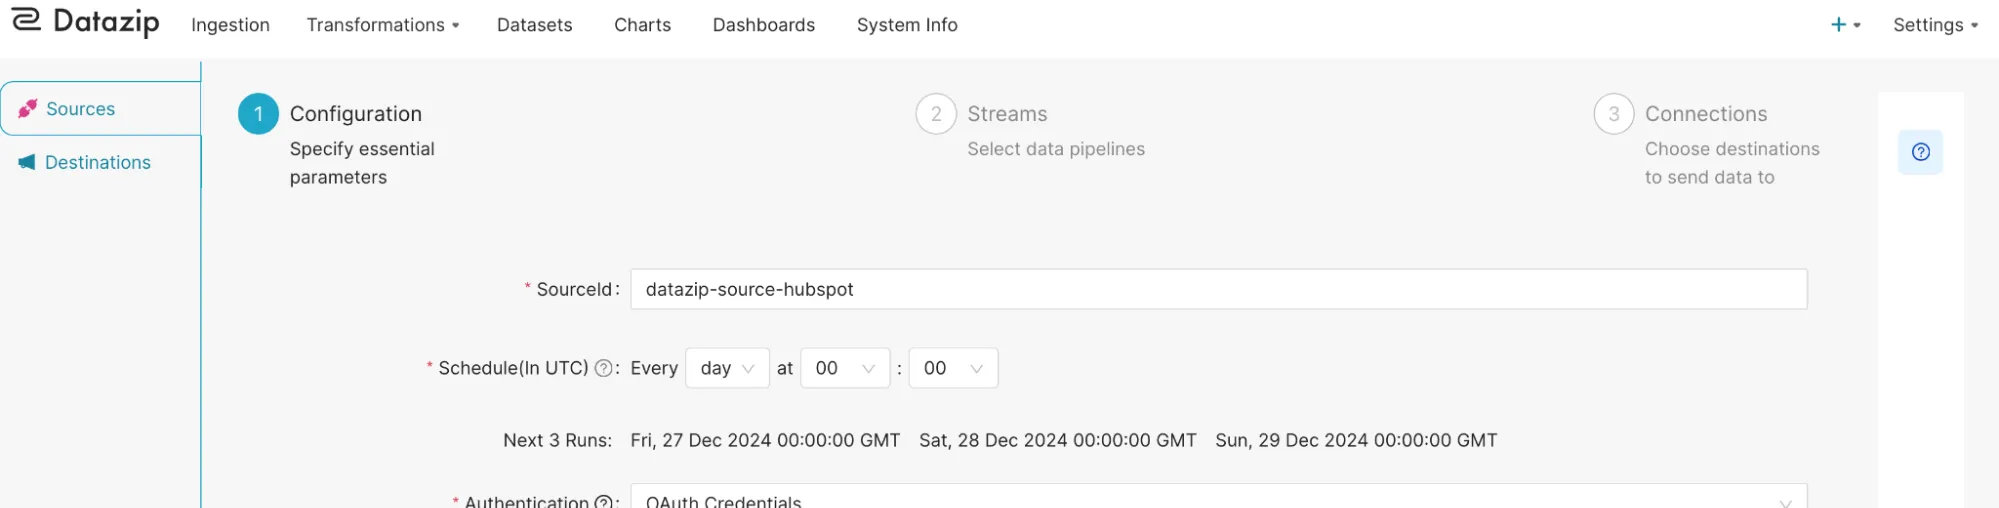
Authentication: Log in to your Datazip account and navigate to the “Ingestion” section.
-
Select Your Sources: Pick from the list—Google Analytics, Google Ads, etc. Authorize access in a few clicks.
-
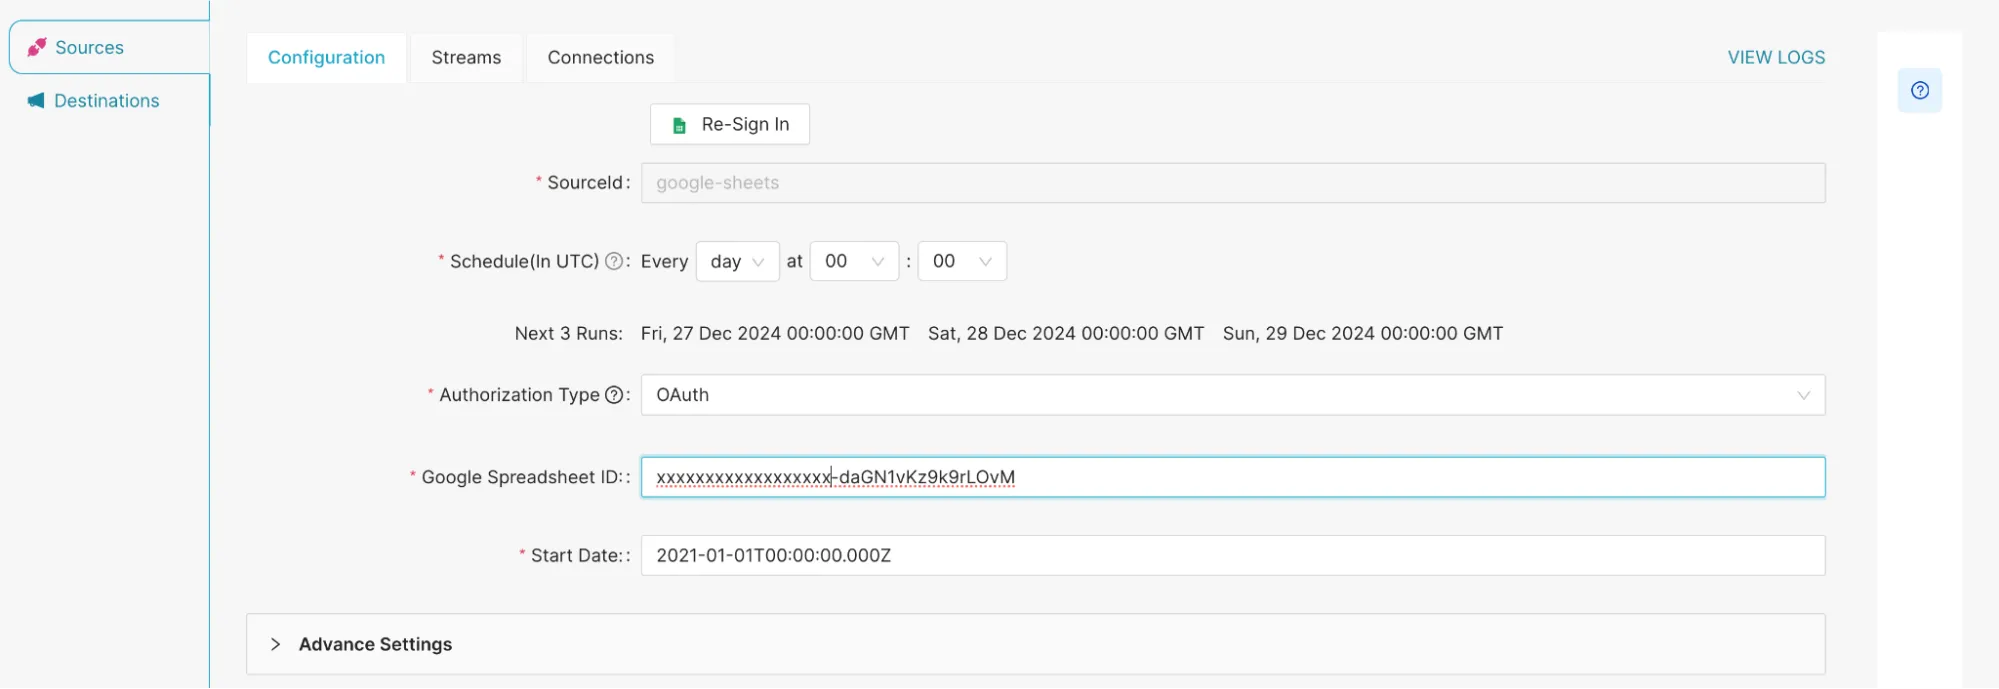
Configuration: Choose your sync schedule (e.g., daily at 2 AM) and specify any selective sync preferences (e.g., only certain spreadsheets from Google Sheets).
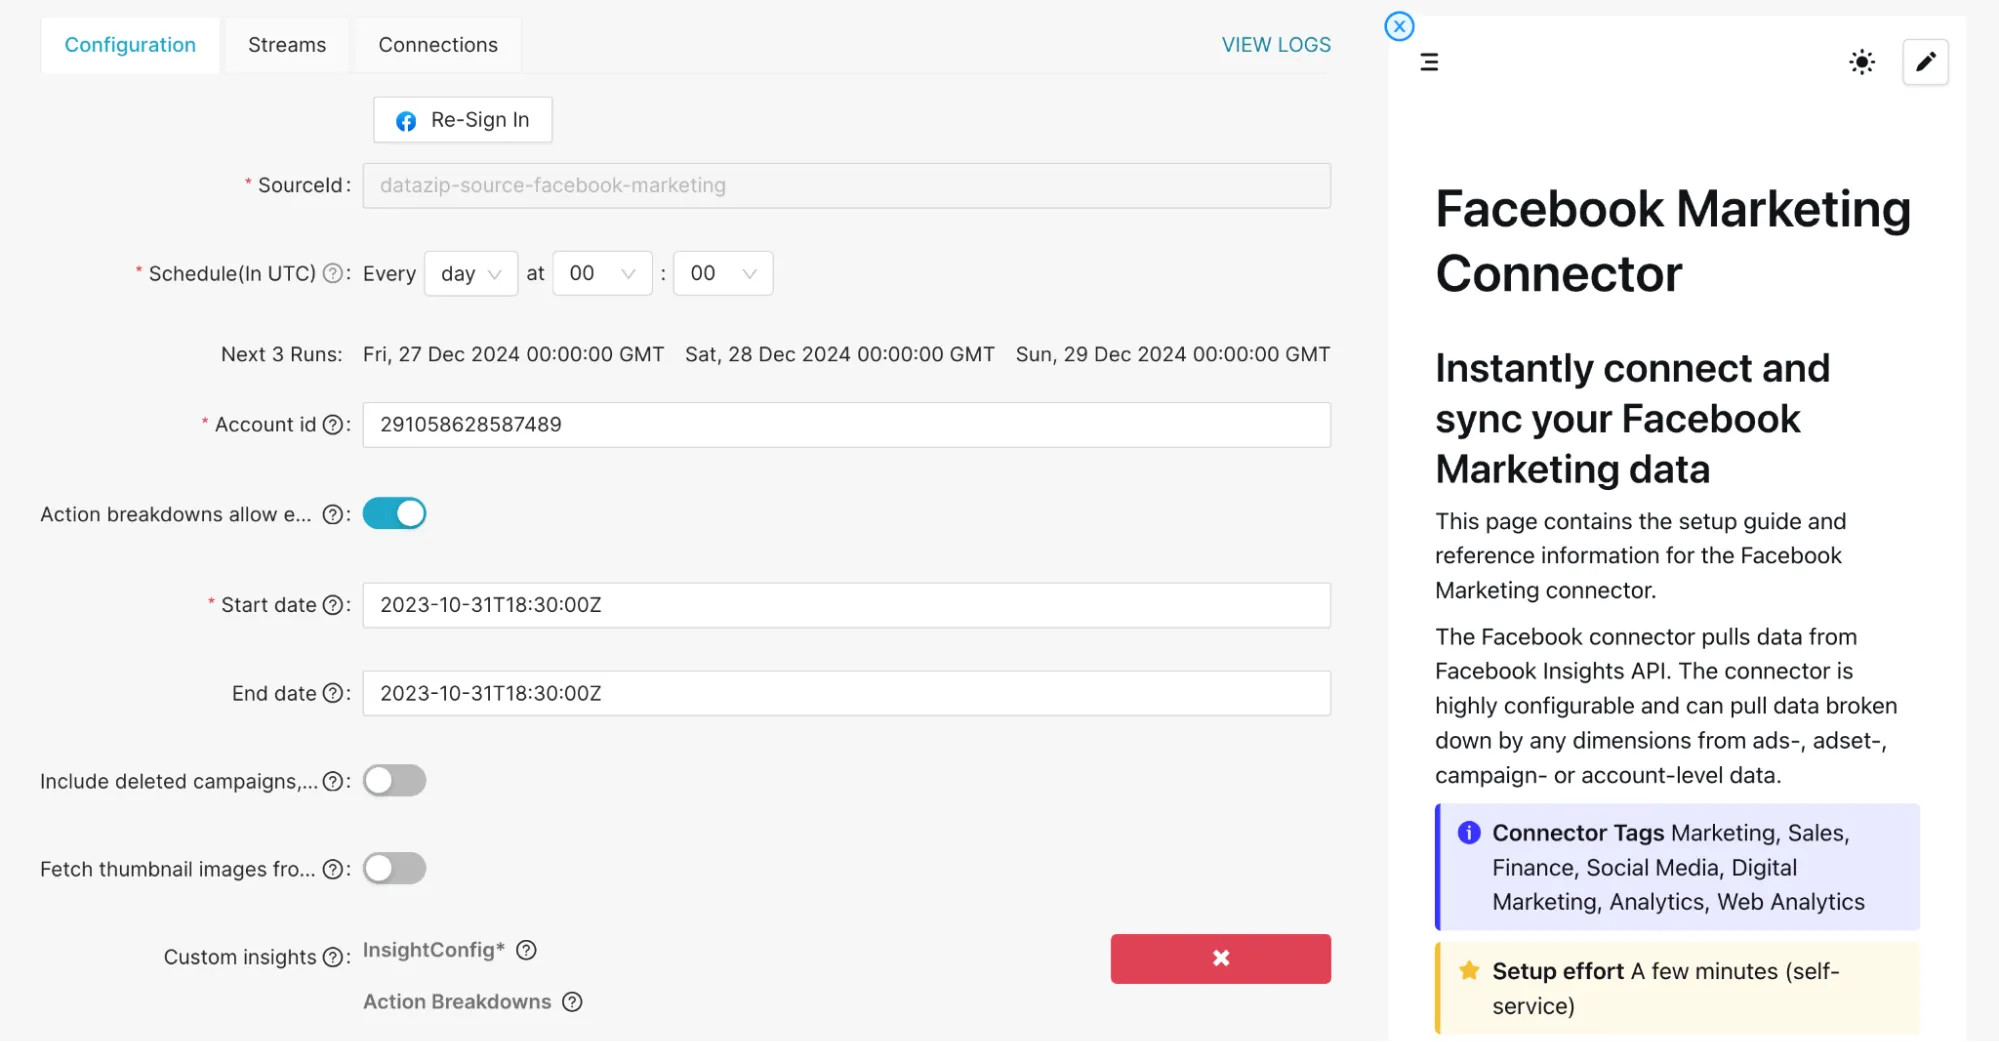
Figure showing Facebook Advertising Source Connector config page and related docs on the right side, built in UI.
-
Preview Data: Before finalizing, preview your data to ensure everything looks correct—table names, columns, etc.
-
Transformation Queries: Write or copy-paste your SQL transformations to clean data, remove duplicates, and align naming conventions.
-
Create Views/Dashboards: Build your dashboards or connect to a BI tool (Tableau, Power BI, or even Superset).
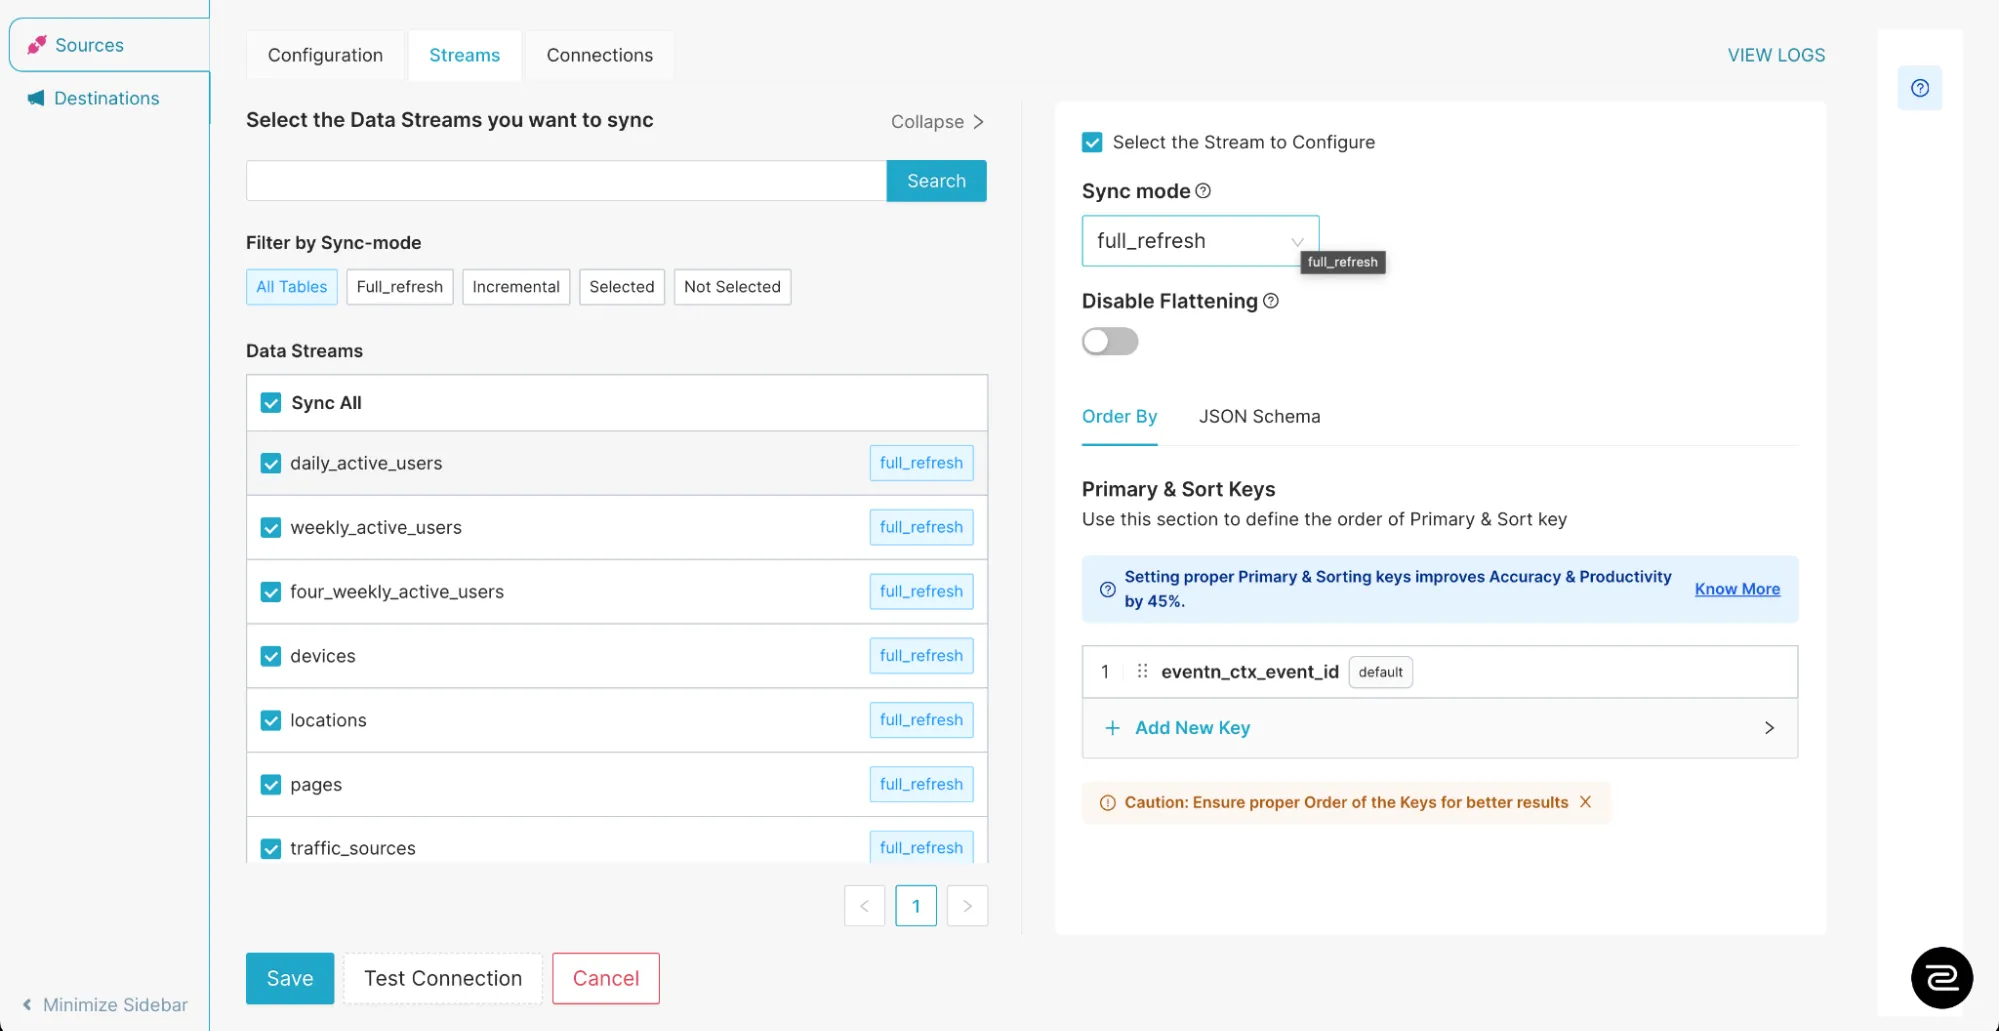
Figure showing stream (tables / collection) whichever you would like to sync and the modes (full refresh, incremental, Flattening, Order By, Schema, etc)
Example Query: Merging Multiple SaaS Sources
Below is a sample SQL snippet you might run in OneStack (or a connected BI tool) to combine Google Ads, HubSpot, and Zoho Books data:
SELECT
    ga.campaign_name,
    ga.clicks AS google_ads_clicks,
    hs.new_leads AS hubspot_leads,
    zb.invoice_amount AS revenue_generated
FROM google_ads_data ga
JOIN hubspot_data hs
    ON ga.campaign_id = hs.campaign_id
JOIN zoho_books_data zb
    ON hs.deal_id = zb.deal_id
WHERE ga.date BETWEEN '2024-01-01' AND '2024-12-31'
  AND zb.invoice_status = 'Paid';
What This Query Does:
-
Google Ads table (
google_ads_dataalias:ga): Provides the campaign name and number of clicks. -
HubSpot table (
hubspot_dataalias:hs): Shows how many new leads each campaign generated. -
Zoho Books table (
zoho_books_dataalias:zb): Displays revenue from paid invoices.
By combining these tables, you can quickly see which campaigns drove the highest revenue and how many clicks each campaign needed to get there.
Example Query: Calculate Customer Acquisition Cost (CAC) Per Campaign
Goal: Find out how much you’re spending on ads per new customer.
SELECT
    ga.campaign_name,
    SUM(ga.ad_spend) AS total_ad_spend,
    COUNT(DISTINCT hs.customer_id) AS new_customers_acquired,
    CASE
        WHEN COUNT(DISTINCT hs.customer_id) = 0
             THEN 0
        ELSE SUM(ga.ad_spend) / COUNT(DISTINCT hs.customer_id)
    END AS cac_per_customer
FROM google_ads_data ga
JOIN hubspot_data hs
    ON ga.campaign_id = hs.campaign_id
    -- assuming `customer_id` in HubSpot data indicates a newly acquired customer
WHERE ga.date BETWEEN '2024-01-01' AND '2024-12-31'
GROUP BY ga.campaign_name
ORDER BY cac_per_customer ASC;
What This Query Does:
-
Sums the total ad_spend from Google Ads (e.g., cost spent on clicks or impressions).
-
Counts the number of new customers from HubSpot (
hs.customer_id). -
Divides
total_ad_spendby the number of new customers to get CAC.
Example Query: Revenue vs. Ad Spend (ROI) Per Campaign
Goal: Compare how much you spent vs. how much revenue you brought in from each campaign.
SELECT
    ga.campaign_name,
    SUM(ga.ad_spend) AS total_ad_spend,
    SUM(zb.invoice_amount) AS total_revenue,
    CASE
        WHEN SUM(ga.ad_spend) = 0
             THEN 0
        ELSE (SUM(zb.invoice_amount) / SUM(ga.ad_spend))
    END AS return_on_ad_spend
FROM google_ads_data ga
JOIN hubspot_data hs
    ON ga.campaign_id = hs.campaign_id
JOIN zoho_books_data zb
    ON hs.deal_id = zb.deal_id
WHERE ga.date BETWEEN '2024-01-01' AND '2024-12-31'
  AND zb.invoice_status = 'Paid'
GROUP BY ga.campaign_name
ORDER BY return_on_ad_spend DESC;
What This Query Does:
-
Sums total ad_spend from Google Ads.
-
Sums total invoice_amount from Zoho Books (only Paid invoices).
-
Calculates Return on Ad Spend (ROAS) =
total_revenue÷total_ad_spend.
And many more such queries can easily be written on top of the warehouse to make specific data models for your chart creation.
Pro Tips for a Smooth Integration
-
Plan Your Data Model: Before pulling any data, decide how you want to join multiple sources. Sketch a small ER diagram to clarify relationships like “
campaign_id” across Google Ads and HubSpot. -
Automate Data Quality Checks: Set alerts for anomalies (e.g., if HubSpot leads drop to zero in one day). This ensures you’re not making decisions based on inaccurate data.
-
Use Incremental Loading: Especially for large datasets (like historical GA4 logs), do incremental loads to optimize performance and reduce bandwidth usage.
-
Secure Your Connections: Always enable two-factor authentication (2FA) and follow best practices. Datazip’s OneStack supports secure protocols to ensure no unauthorized access.
Connecting BI Tools (Metabase / Tableau / Superset / PowerBI / Redash) with you SaaS data and Seeing Immediate Improvements in chart rendering times
Refer to our guide on “Connecting your BI tool with OneStack Data for faster chart loading times” here.
Running Queries with SaaS data source and multiple Database data (MongoDB + Postgres + Google Analytics)
Modern analytics often requires combining data from multiple sources—maybe you want to join mongoDB data with a SQL database or with a SaaS application’s API data.
Since Datazip supports 150+ source connectors, you can pull data from multiple DBs and SaaS sources into a unified analytical layer. Suddenly, joining across sources and building holistic dashboards becomes trivial and fast.
If your final query requires you to aggregate data from multiple database sources, a SaaS source, you can perform those queries here as well.
- Sync Database1 with OneStack
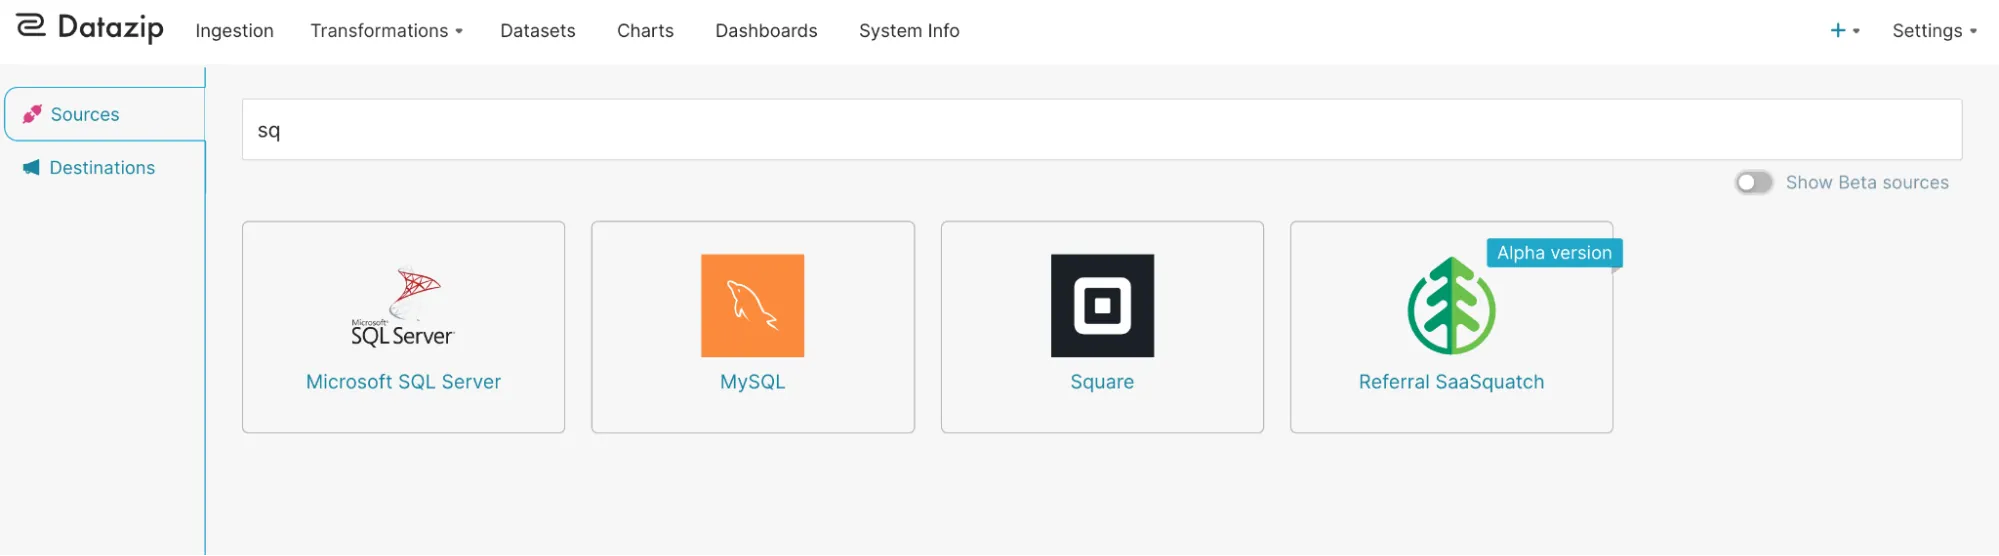
Fig: 4 of 150+ connectors
- Sync Database2 with OneStack
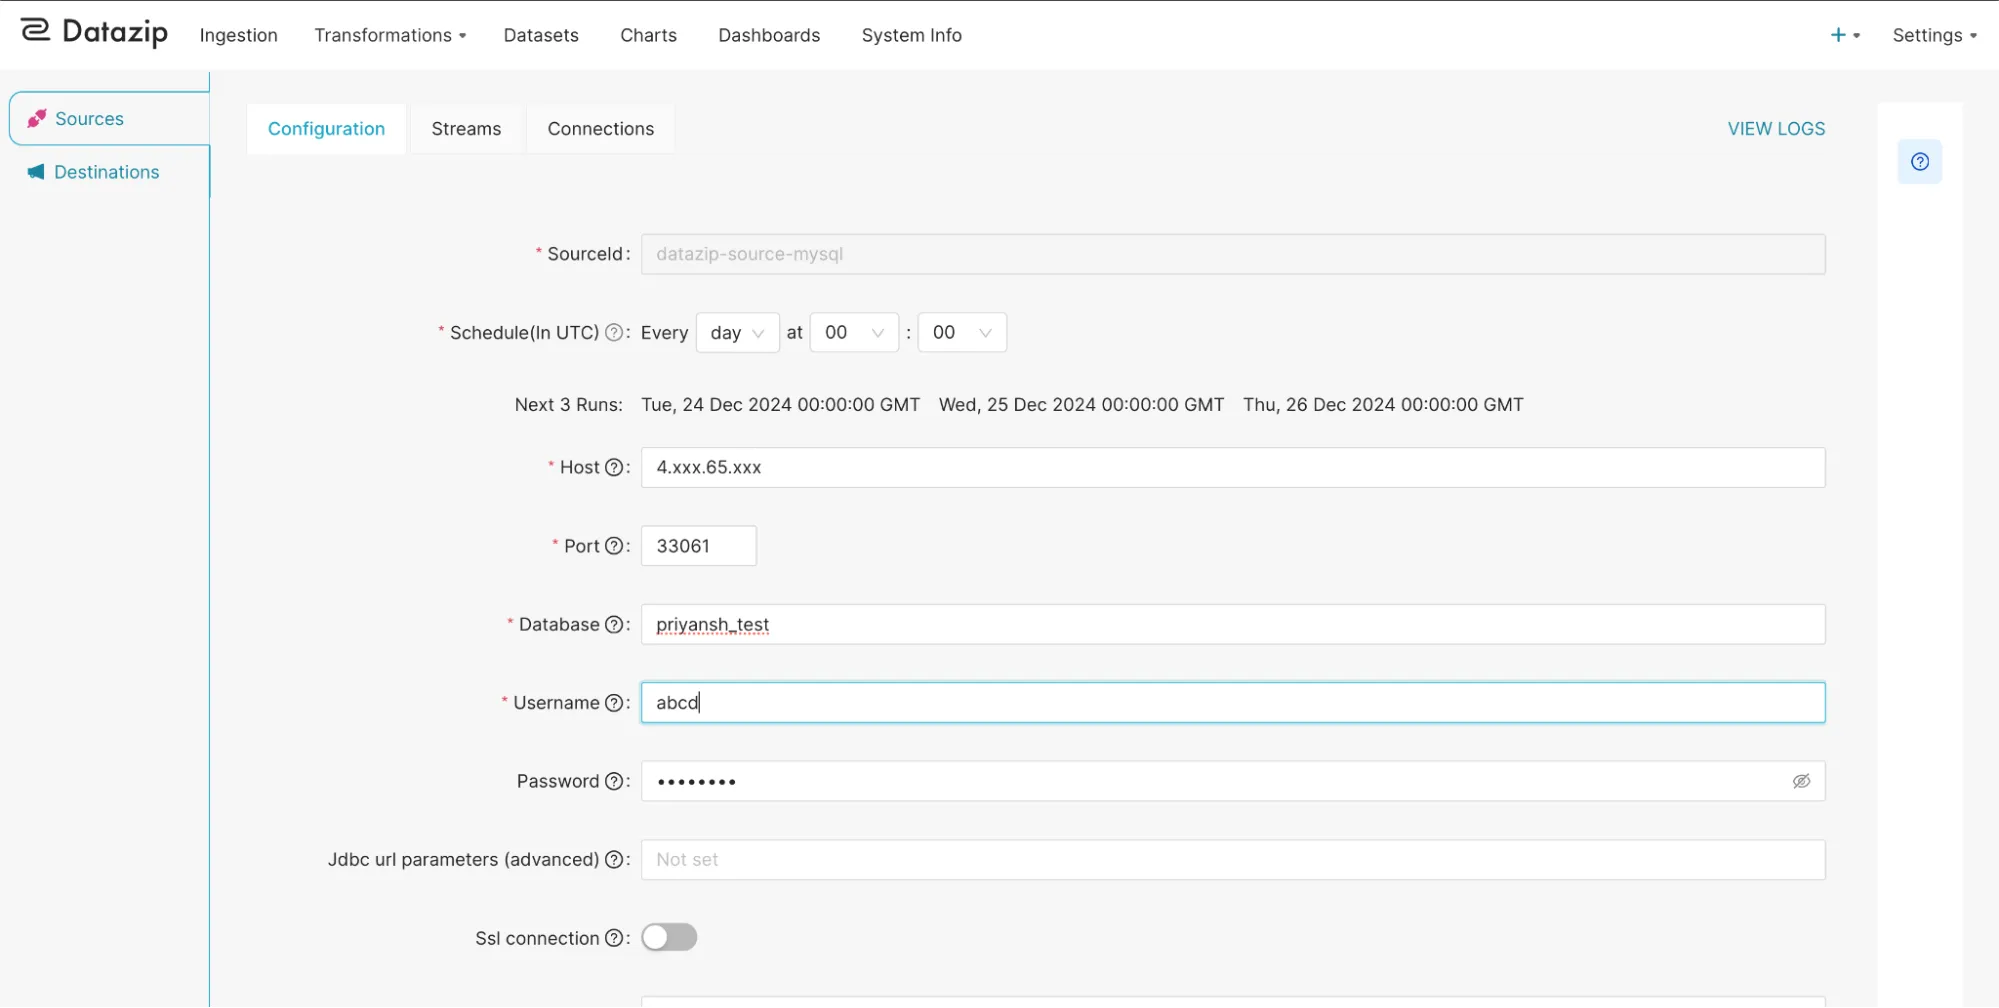
Fig: Add database details to connect and sync data instantly.
-
Sync SaaS source data with OneStack (click here to see all the SaaS source connectors we support).
-
Decide the joining key (assuming your data has some common key to make a JOIN)
-
Run the query.
-
Yeah that’s basically it.
Refer the below picture
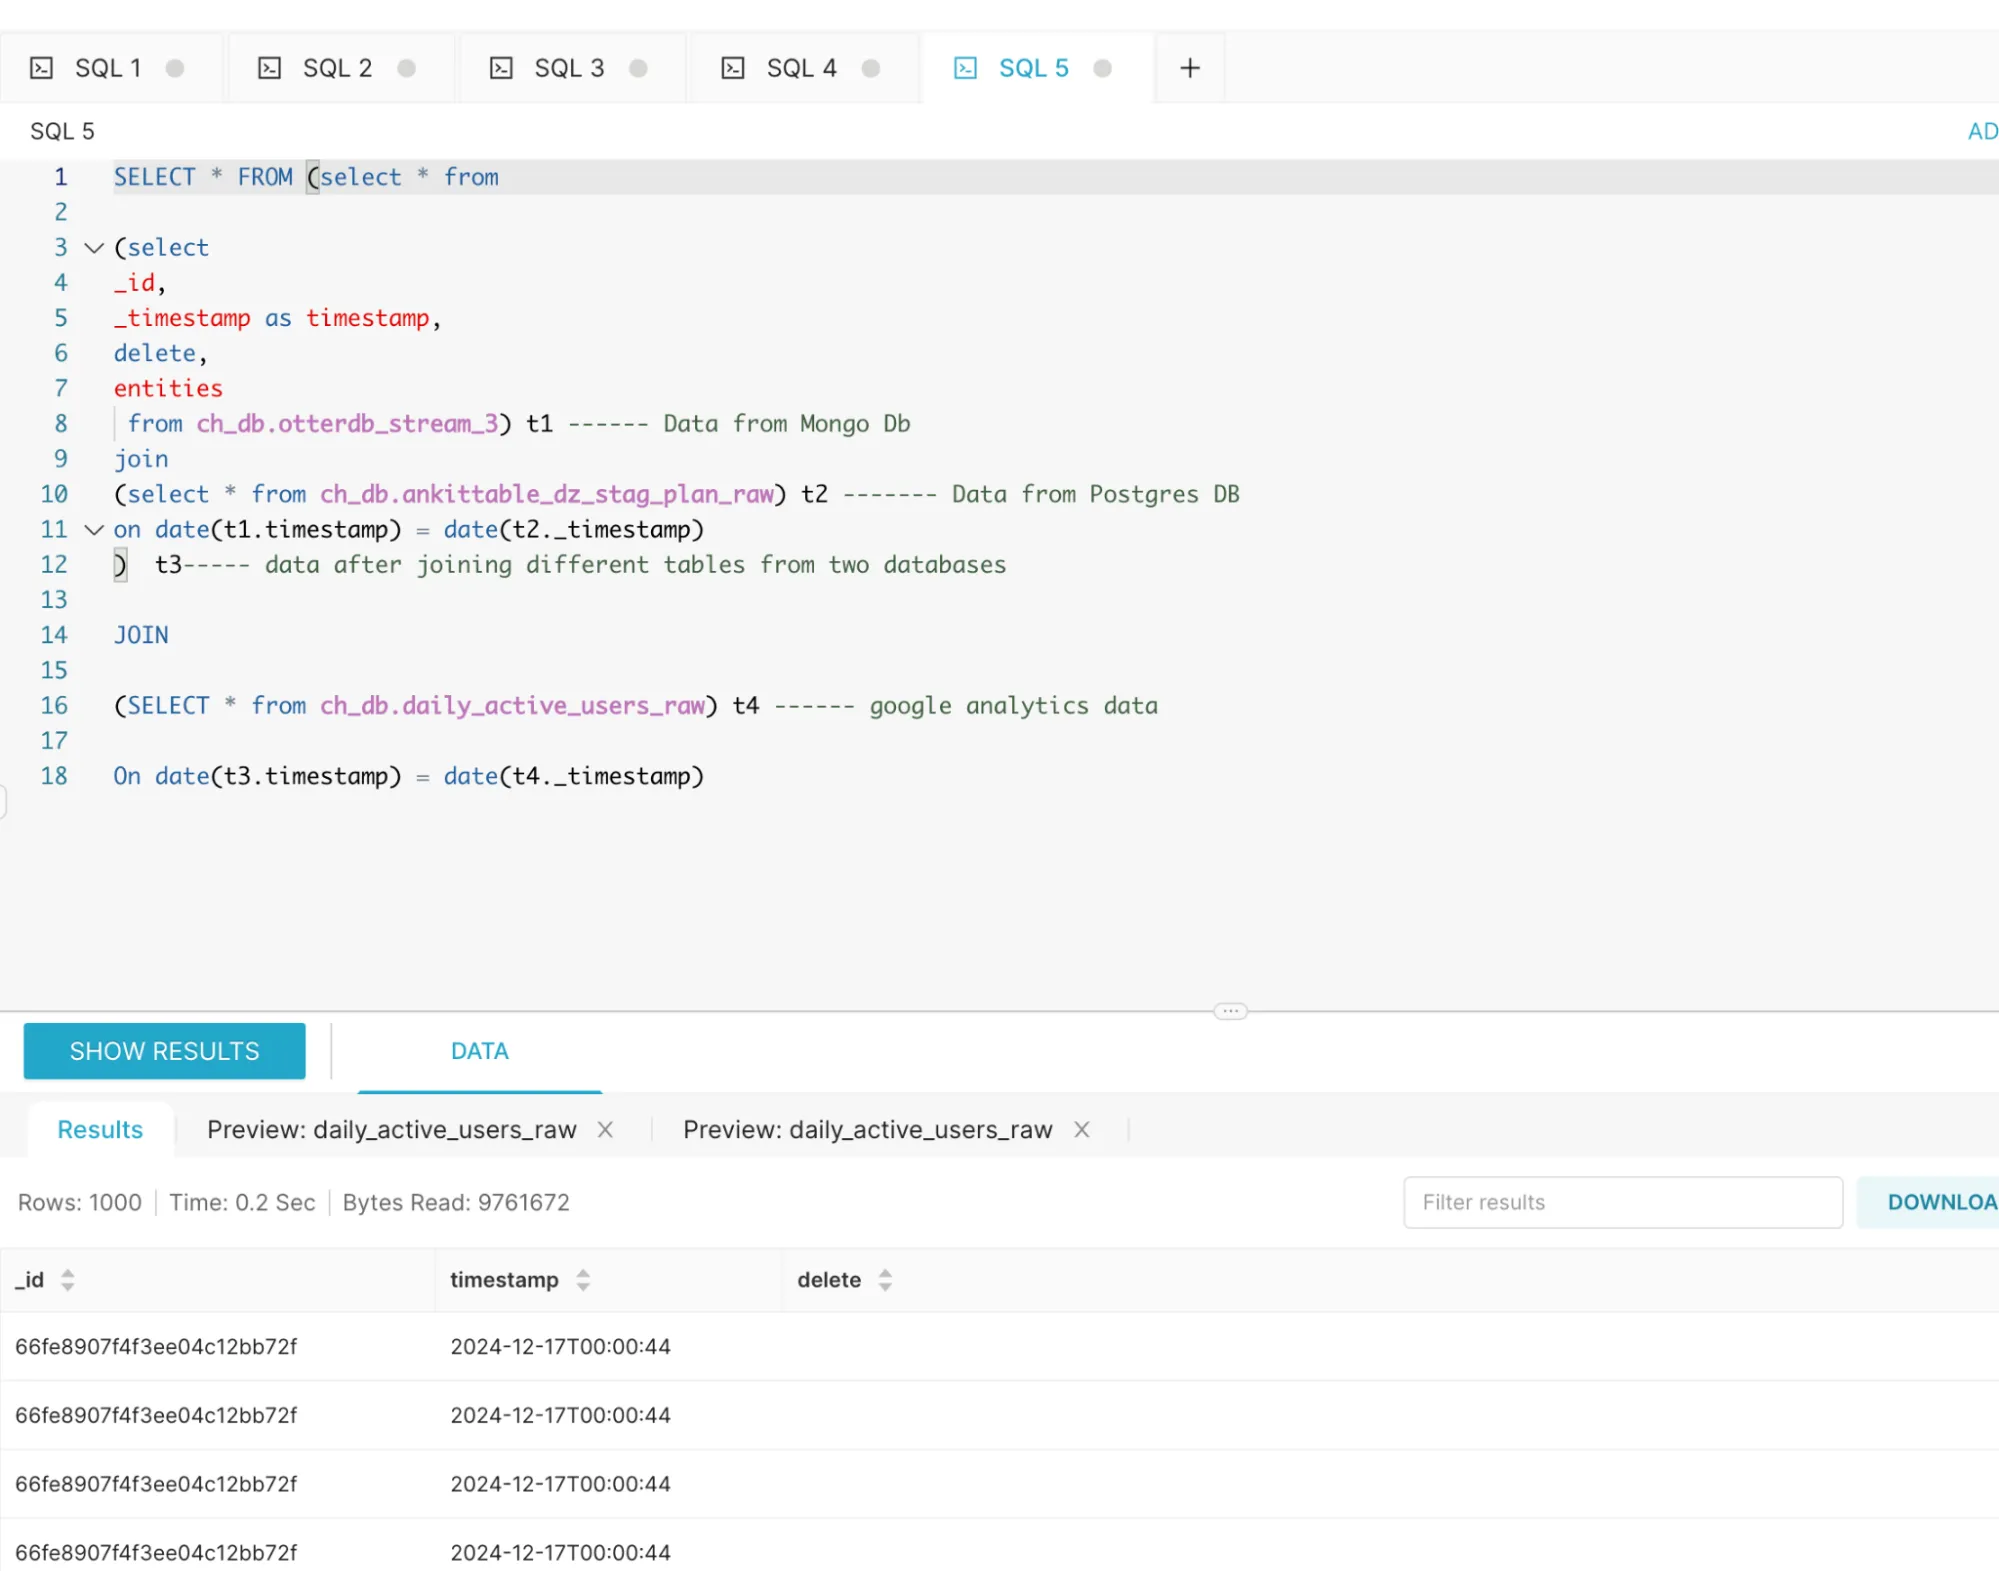
The query:
SELECT *
FROM
(
    SELECT *
    FROM
    (
        -- Data from MongoDB
        SELECT
            _id,
            _timestamp AS timestamp,
            delete,
            entities
        FROM ch_db.otterdb_stream_3
    ) t1
    JOIN
    (
        -- Data from Postgres DB
        SELECT *
        FROM ch_db.ankittable_dz_stag_plan_raw
    ) t2
        ON DATE(t1.timestamp) = DATE(t2._timestamp)
) t3  -- Data after joining different tables from two databases
JOIN
(
    -- Google Analytics data
    SELECT *
    FROM ch_db.daily_active_users_raw
) t4
    ON DATE(t3.timestamp) = DATE(t4._timestamp);
Here, we used the Data from MongoDB + Postgres and Google Analytics to show even joining multiple Databases together and on top of that joining another SaaS source and running queries under 1 second is also possible with OneStack Data. So, what are you waiting for?
Final Thoughts
By leveraging Datazip’s OneStack, startups, SMBs and global enterprises alike can transform the way they handle data. No more wrestling with CSV exports or building manual scripts to merge data in Excel. Instead, you enjoy a streamlined, automated system that aggregates your data sources—be it Google Analytics, Firebase, or Zoho Books—into a single warehouse.
You can then run cross-platform queries, gain real insights, and confidently make data-driven decisions.
Stay tuned and get ready to unlock the next level of analytics maturity with OneStack!
If you have any questions or want to learn more, drop us a line at [email protected] or book a quick demo meeting with us.