What is Dimensional Data Modeling? Your go-to guide

Check out OLake, our latest open source offering for replicating databases to lakehouses.
Imagine you're a data whiz, doing your analyst thing all solo without any analytics or data engineer buddies on your team. So, you've got this raw data and a cool BI tool, and the job is to jazz up that raw data and create some snazzy visualizations, all within the BI tool.
But here's the hitch - you're stuck doing the same old data merges and key calculations over and over. Your dashboards hit the brakes, your time is getting eaten up by repetitive code, and oops, mistakes are peeking around the corner.
Cue the superhero entrance of data modeling! It's like the secret sauce that solves exactly this headache. This is why analytics engineers are a thing! Data modeling hands analysts pre-cooked, standardized datasets.
No more endless joining or transforming raw data. The heavy lifting is done, so analysts can zoom in on delivering results fast and without the headache.
Data Modeling 101: The Importance of Data Modeling in Data Engineering/Analytics
What is Dimensional Data Modeling?
Dimensional data modeling stands out as an analytical strategy applied in databases and data warehouses, aiming to arrange and classify facts within dimension tables. This approach facilitates the swift extraction of information from extensive datasets by establishing a framework that isolates irrelevant or non-essential data.
The dimensional model not only streamlines data retrieval but also reveals connections among diverse data types, enabling a more profound exploration of trends and patterns.
This approach centers around pinpointing essential business processes and establishing the groundwork for these processes before introducing supplementary tables.
In summary, Data dimensional modeling is like the architect's blueprint for databases in the world of business and data analysis. Imagine you're organizing a messy room - you want everything in a way that makes sense and is easy to find.
In this modeling approach, there are two main types of tables, Facts & Dimension Tables.
Dimension Tables: These tables store descriptive information that provides context to the data in the fact tables. Dimensions are the characteristics by which users want to analyze the data.
Examples of dimensions include time, geography, product, or customer. Dimension tables usually have a primary key that is referenced by foreign keys in the fact tables.
For instance, suppose a business wants to analyze marketing data. In that case, the dimensions could include customers, products, campaigns, regions, and time, while the facts could be the number of campaign views, the total clicks, and the cost.
Types of dimensional data tables

Fact Tables
These tables contain quantitative data (facts) that are typically numerical and represent business metrics, such as sales, revenue, or quantity sold.
Fact tables also include foreign keys that link to dimension tables. Fact tables can be viewed as records generated by various events within a business.
These events could encompass diverse transactions, placed orders, or funds allocated for marketing advertisements. Essentially, if it's an action that can happen, it usually finds representation as a fact table in the data warehouse.
Fact tables play matchmaker by holding foreign keys that connect directly to the primary keys of dimension tables, creating a relationship dance. Each fact table can have multiple foreign keys, each tying the knot with different dimension tables.
It's worth noting that fact tables steer clear of crunching numerical aggregates; those calculations happen in the business intelligence layer. Every row in a fact table is like a snapshot of a specific business event.
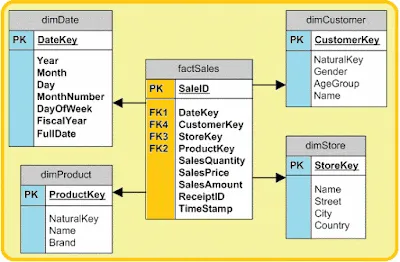
For instance, if you spot DateKey, ProductKey, StoreKey, and CustomerKey in the fact table shown in above image, these are like keys to different dimension tables. These fact tables, detailed and granular, set the stage for calculating KPIs on different business levels.
So, if a business user wants to figure out the total number of products sold in a month by a specific store, the data analyst would use a fact model, leaving the actual calculation of aggregation for the BI layer.
Dimensions Tables
In contrast to fact tables, which log business measurements, dimension tables hold descriptive attributes. These tables are often broad and flat, maintaining a denormalized structure with a single primary key, also acting as a foreign key in a connected fact table.
For Example, in the above image ProductKey was the foreign key in sales fact table (factSales) but it is the primary key of the products dimension table (dimProduct).
In a business setting, dimension tables, like the ones outlining product specifics, experience infrequent changes compared to the dynamic nature of fact tables. Analytics engineers refer to dimension tables when specifics such as color, size, fabric, or product type are required for their data model.
Analytics data modeling often involves the integration of fact and dimension tables, simplifying the work for data analysts by providing a comprehensive dataset without the need for additional joins in the BI tool.